amber rose
Introduction
Financial markets move faster than ever before. Every second, millions of transactions occur across stock exchanges, cryptocurrency platforms, forex markets, and commodity trading systems worldwide. To keep up with these rapid changes, traders and investors rely heavily on Custom Real-Time Charts.
A custom real-time chart is more than just a visual graph. It is a powerful decision-making tool that allows users to monitor price movements, identify trends, apply technical indicators, and react instantly to changing market conditions.
Modern charting platforms now include artificial intelligence, cloud synchronization, mobile compatibility, and advanced technical analysis features. Whether you are a beginner trader or an institutional investor, custom chart systems can significantly improve trading performance and market understanding.
What Is a Custom Real-Time Chart?
A Custom Real-Time Chart is a live graphical representation of continuously updating market data that users can personalize according to their needs.
Unlike traditional static charts, real-time charts automatically refresh as new information enters the market.
These charts typically display:
- Live prices
- Market trends
- Trading volume
- Volatility
- Technical indicators
- Economic data
- Order flow activity
Customization options allow traders to modify:
- Timeframes
- Colors
- Layouts
- Indicators
- Alerts
- Drawing tools
Why Real-Time Charts Are Essential
Modern financial markets are highly competitive. Delayed information can lead to missed opportunities and increased risk.
Instant Market Awareness
Real-time updates help traders react quickly to price changes.
Better Technical Analysis
Indicators update continuously for more accurate signals.
Enhanced Trading Speed
Day traders and scalpers depend on millisecond-level updates.
Improved Risk Management
Traders can set instant alerts and stop-loss strategies.
More Professional Workflow
Custom layouts help organize market analysis efficiently.
Core Components of a Custom Real-Time Chart
Price Data Feed
The chart receives live data from exchanges or liquidity providers.
Rendering Engine
The visualization system converts raw data into readable graphics.
Technical Analysis Layer
Indicators calculate trends and momentum automatically.
User Interface
The interface allows interaction with chart tools and layouts.
Notification System
Alerts notify traders about important market events.
Types of Real-Time Charts
Different chart styles serve different analytical purposes.
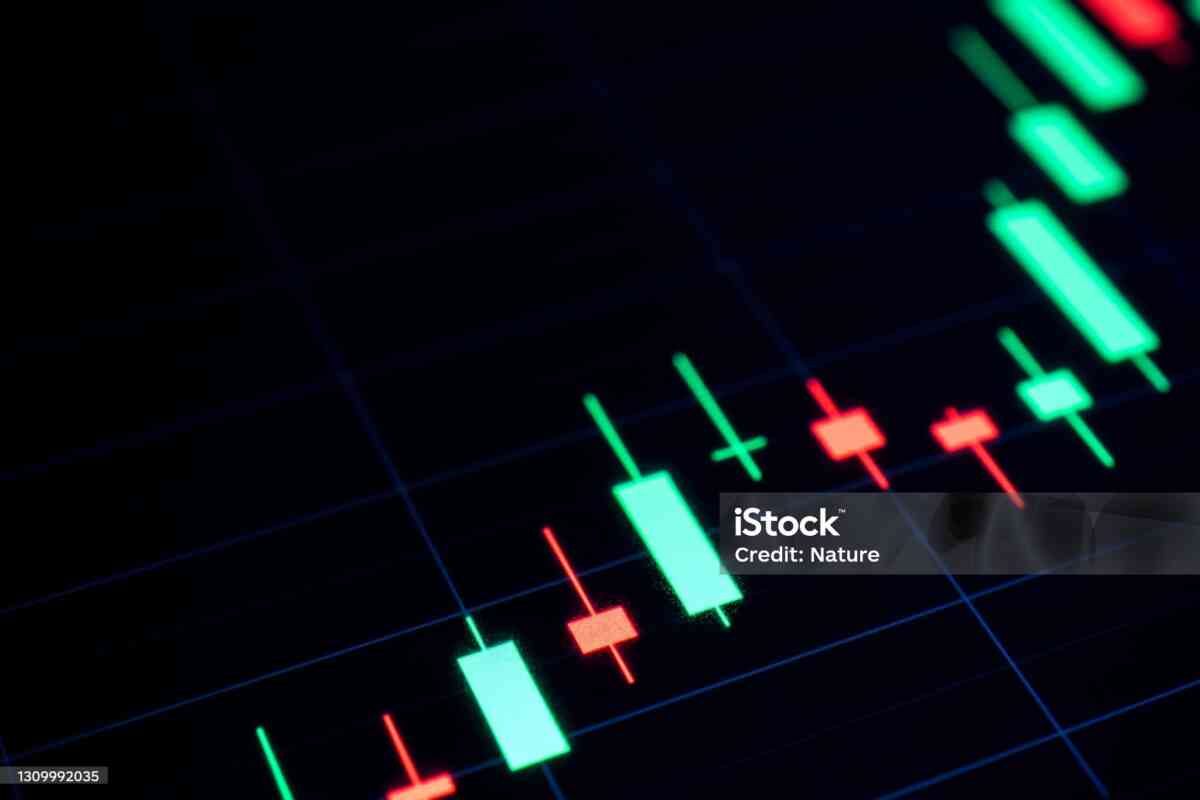
Candlestick Charts
Candlestick charts are the most popular among professional traders.


Each candlestick represents:
- Opening price
- Closing price
- Highest price
- Lowest price
Candlestick patterns help traders identify reversals and breakouts.
Line Charts
Line charts are simple and easy to understand.


Best used for:
- Long-term analysis
- Market overviews
- Beginner traders
Bar Charts
Bar charts provide detailed pricing information.


Area Charts
Area charts emphasize cumulative growth.


Popular Technical Indicators
Technical indicators are critical for advanced trading.
Moving Averages
Help identify market trends.
RSI (Relative Strength Index)
Measures overbought and oversold conditions.
MACD
Tracks momentum and trend direction.
Bollinger Bands
Analyze market volatility.
Fibonacci Retracement
Identifies support and resistance levels.
Customization Features
Modern chart platforms allow extensive customization.
Multi-Chart Layouts
View multiple assets simultaneously.
Color Themes
Choose dark mode or light mode.
Personalized Indicators
Save favorite technical setups.
Drawing Tools
Use trend lines, channels, and annotations.
Alert Systems
Receive notifications instantly.
Real-Time Charts in Cryptocurrency Trading
Cryptocurrency markets never sleep. Real-time charts are essential for crypto traders.
Key Crypto Features
- 24/7 live updates
- High volatility monitoring
- Whale tracking
- Volume analysis
Popular Crypto Assets
- Bitcoin
- Ethereum
- Solana
- XRP
- BNB


Real-Time Forex Charts
Forex traders rely heavily on custom chart systems.
Important Forex Data
- Currency pair movement
- Interest rate changes
- Economic news
- Central bank announcements
Popular pairs include:
- EUR/USD
- USD/JPY
- GBP/USD
- AUD/USD
Stock Market Chart Systems
Stock traders use advanced charting tools for:
- Day trading
- Swing trading
- Long-term investing
- Options trading
Advanced Stock Features
- Level 2 market depth
- Institutional volume tracking
- Earnings overlays
- Sector heatmaps


Real-Time Charts and Artificial Intelligence
Artificial intelligence is changing financial analysis.
AI-Powered Features
- Predictive trend analysis
- Pattern recognition
- Automated alerts
- Smart trading bots
- Sentiment monitoring
AI helps traders process large amounts of market data efficiently.
Mobile Trading and Real-Time Charts
Mobile charting has become extremely important.
Mobile Features
- Push notifications
- Cloud synchronization
- Multi-device access
- One-touch trading
Traders can now monitor markets anywhere.
Web Technologies Behind Real-Time Charts
Several technologies power modern chart systems.
WebSocket Connections
Provide instant live data updates.
Cloud Computing
Ensures scalability and stability.
APIs
Deliver market data feeds.
Popular APIs include:
- Binance API
- Alpha Vantage
- Polygon.io
- Yahoo Finance
Benefits for Businesses
Real-time charts are useful beyond trading.
Business Applications
- Sales monitoring
- Logistics tracking
- Website analytics
- Marketing dashboards
- Customer engagement analysis
Challenges of Real-Time Chart Systems
Despite their advantages, real-time charts face technical challenges.
Latency
Slow internet connections can delay updates.
Infrastructure Costs
Streaming large amounts of data requires expensive servers.
Data Accuracy
Poor-quality data can produce misleading signals.
Overcomplicated Layouts
Too many indicators may reduce clarity.
Best Practices for Using Real-Time Charts
Keep Charts Clean
Avoid unnecessary indicators.
Focus on Risk Management
Always use stop-loss strategies.
Analyze Multiple Timeframes
Combine short and long-term analysis.
Test Trading Strategies
Use backtesting before live trading.
Stay Updated
Follow financial news and economic events.
Example of Real-Time Market Performance
Future Trends in Real-Time Charting
Technology continues evolving rapidly.
Emerging Innovations
- AI-generated analysis
- Voice-controlled trading
- Virtual reality dashboards
- Blockchain analytics
- Automated trading ecosystems
Future chart systems will become more intelligent and interactive.
SEO Advantages of Real-Time Chart Websites
Financial websites using live charts often generate strong search engine traffic.
SEO Benefits
- High CPC keywords
- Long user sessions
- Repeat visitors
- Strong engagement metrics
- Increased advertising revenue
Conclusion
Custom Real-Time Charts have transformed how traders and businesses analyze data. Their ability to display live information instantly gives users a significant competitive advantage in modern financial markets.
From cryptocurrency and forex trading to business analytics and AI-driven forecasting, real-time charts continue shaping the future of digital decision-making.
As technology improves, these chart systems will become even faster, smarter, and more customizable, helping users navigate increasingly complex markets with confidence.