Kelly stewart
Introduction
Financial markets generate enormous amounts of information every second. Prices rise and fall, trading volumes fluctuate, sectors rotate, and investor sentiment changes continuously. For traders and investors, understanding this complex environment quickly is essential for success.
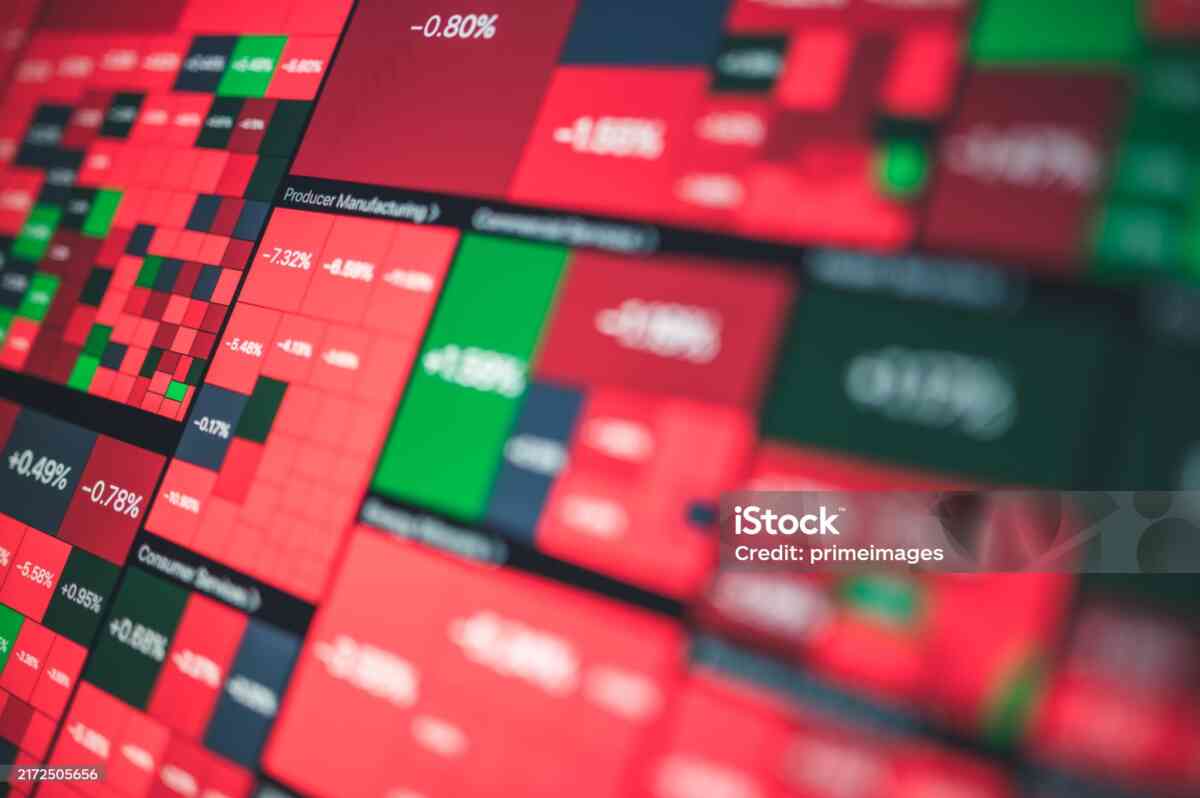
One of the most efficient tools developed for this purpose is the Stock Heatmap Monitor.
A Stock Heatmap Monitor converts raw market data into a visual interface that uses colors, sizes, and layouts to reveal market conditions instantly. Instead of reading spreadsheets or manually analyzing hundreds of charts, traders can identify opportunities and risks within seconds.
Heatmaps are now widely used in:
- Stock trading
- Forex analysis
- Cryptocurrency monitoring
- Commodity trading
- Institutional portfolio management
This article explains how Stock Heatmap Monitors help traders identify trends, improve timing, manage risk, and make smarter trading decisions.
Understanding Market Visualization
The human brain processes visual information far faster than text or numbers.
Heatmaps take advantage of this by organizing complex data into:
- Color patterns
- Sector blocks
- Relative sizing
- Real-time movement
A trader can instantly recognize:
- Which sectors are strong
- Which stocks are weak
- Where momentum exists
- Where risk is increasing
This creates a major advantage in fast-moving markets.
The Core Structure of a Stock Heatmap
Rectangles and Tiles
Each stock appears as a tile.
Tile characteristics include:
- Size
- Color
- Position
- Brightness
Market Capitalization Weighting
Larger companies occupy larger space.
This helps traders understand how major companies influence the overall market.
Color Interpretation
Colors represent performance.
Typical examples:
- Bright green = strong bullish movement
- Dark green = moderate bullish movement
- Neutral gray = sideways movement
- Light red = mild weakness
- Dark red = heavy selling pressure
Trend Detection Using Heatmaps
Trend detection is one of the primary functions of a Stock Heatmap Monitor.
Bullish Market Detection
A market dominated by green sectors often signals:
- Positive sentiment
- Institutional buying
- Strong momentum
Bearish Market Detection
Large red clusters may indicate:
- Fear
- Profit-taking
- Economic uncertainty
Sideways Market Recognition
Mixed colors often suggest:
- Consolidation
- Market indecision
- Reduced momentum
Understanding market structure helps traders avoid poor timing.
Sector Rotation Analysis
Institutional money constantly rotates between sectors.
Examples:
- Technology during innovation booms
- Energy during oil price rallies
- Consumer staples during recessions
- Healthcare during defensive periods
Heatmaps allow traders to visualize sector rotation immediately.
This helps traders:
- Follow institutional money flow
- Align trades with market trends
- Avoid weak industries
Momentum Trading with Heatmaps
Momentum traders seek stocks moving strongly in one direction.
Heatmaps help identify:
- Fastest gainers
- Strongest sectors
- High-volume breakouts
Momentum traders often focus on:
- Bright green stocks
- Increasing volume
- Sector-wide participation
This increases the probability of trend continuation.
Identifying Market Breadth
Market breadth measures how many stocks participate in a trend.
A healthy bullish market usually includes:
- Many advancing stocks
- Strong sector participation
- Broad buying pressure
Heatmaps visually reveal breadth conditions.
Weak breadth may warn traders that a rally lacks strength.
Volume Analysis in Heatmaps
Some heatmaps integrate trading volume directly.
This helps identify:
- Institutional buying
- Unusual activity
- Breakout confirmation
Volume-based heatmaps are extremely valuable during:
- Earnings season
- Economic announcements
- Market crashes
High volume often confirms trend reliability.
Intraday Heatmap Trading
Day traders rely heavily on intraday heatmaps.
They monitor:
- Opening momentum
- Midday reversals
- Closing strength
- Sector leadership
Heatmaps provide:
- Fast market scanning
- Efficient trade filtering
- Real-time awareness
This improves reaction speed significantly.
Swing Trading Applications
Swing traders focus on multi-day moves.
Heatmaps help swing traders:
- Track sector momentum
- Identify strong trends
- Avoid weak stocks
- Monitor market cycles
Weekly heatmaps often provide clearer signals than intraday noise.
Long-Term Investing Applications
Long-term investors use heatmaps differently from day traders.
They focus on:
- Sector diversification
- Economic cycles
- Portfolio balance
- Long-term trends
Heatmaps simplify portfolio management and risk assessment.
Heatmaps and Risk Management
Risk management is critical in trading.
Heatmaps improve risk awareness by revealing:
- Overheated sectors
- Extreme volatility
- Market panic
- Concentration risk
This helps traders:
- Reduce exposure
- Protect profits
- Avoid emotional decisions
Psychological Advantages of Heatmaps
Trading psychology greatly affects performance.
Heatmaps reduce mental strain by simplifying information.
Benefits include:
- Reduced analysis paralysis
- Faster interpretation
- Lower emotional stress
- Better focus
Visual clarity improves discipline.
AI-Powered Heatmap Technology
Artificial intelligence has transformed market analysis.
Modern heatmaps now include:
- Predictive analytics
- Smart alerts
- AI sentiment analysis
- Pattern recognition
- Machine learning models
AI can detect unusual market behavior faster than humans.
Heatmaps in High-Frequency Trading
High-frequency trading firms process massive data streams.
Heatmaps help monitor:
- Liquidity changes
- Flash volatility
- Order flow imbalances
Speed is critical in algorithmic environments.
Cryptocurrency Heatmaps
Crypto markets are extremely volatile.
Crypto heatmaps help traders:
- Track Bitcoin dominance
- Monitor altcoin rotations
- Identify trending narratives
- Detect sudden volatility
Because crypto operates continuously, real-time monitoring is essential.
Forex Heatmaps
Forex heatmaps measure currency strength and weakness.
They help traders identify:
- Strong currencies
- Weak currencies
- Correlated movements
Forex heatmaps improve:
- Pair selection
- Timing
- Relative strength analysis
Common Heatmap Trading Strategies
Sector Strength Strategy
Buy strongest sectors and avoid weakest sectors.
Relative Strength Trading
Focus on stocks outperforming the market.
Gap Momentum Strategy
Trade stocks showing large overnight gaps.
Market Breadth Confirmation
Use breadth to confirm index trends.
Limitations of Heatmaps
Despite their advantages, heatmaps have limitations.
Information Simplification
Heatmaps simplify data and may hide details.
False Momentum
Short-term spikes can appear stronger than they truly are.
Overcrowded Signals
Popular trades may reverse quickly.
Lack of Context
Heatmaps should not replace:
- Fundamental analysis
- Technical analysis
- Economic research
Balanced analysis remains important.
Features of an Ideal Heatmap Platform
A professional heatmap monitor should offer:
- Real-time updates
- Sector organization
- Volume analysis
- Custom watchlists
- AI alerts
- Multi-device support
- Historical replay
- News integration
Advanced traders often customize dashboards heavily.
Institutional Use of Heatmaps
Banks and hedge funds rely heavily on heatmaps.
Institutional uses include:
- Risk analysis
- Market monitoring
- Sector allocation
- Liquidity tracking
Large institutions process enormous data volumes, making visualization essential.
Economic Events and Heatmaps
Major events create dramatic market reactions.
Examples include:
- Interest rate decisions
- Inflation reports
- Corporate earnings
- Geopolitical tensions
Heatmaps quickly show:
- Sector sensitivity
- Market sentiment
- Risk appetite
Future Innovations
Future heatmap technology may include:
- AI trade recommendations
- 3D visualization
- Voice interaction
- Virtual reality dashboards
- Predictive sentiment overlays
Visualization technology will continue evolving rapidly.
Conclusion
Stock Heatmap Monitors have revolutionized modern trading by transforming massive amounts of financial data into clear visual insights.
They help traders:
- Detect trends
- Track sector rotation
- Monitor risk
- Improve timing
- Understand market sentiment
From beginner investors to institutional hedge funds, heatmaps have become an essential component of modern market analysis.
As markets become increasingly data-driven, the importance of visual analytics tools like Stock Heatmap Monitors will continue growing. Traders who learn to use heatmaps effectively gain a powerful advantage in understanding and navigating complex financial markets.

