Kelly stewart
Introduction
Financial markets generate enormous amounts of data every second. Millions of trades occur globally across stock exchanges, creating a constant flow of prices, volume changes, volatility shifts, and market sentiment signals. For traders and investors, understanding this information quickly can mean the difference between profit and loss.
Traditional analysis methods such as spreadsheets, charts, and watchlists remain important, but modern markets increasingly require faster and more visual approaches. This is why Stock Heatmap Monitors have become essential tools in trading, investing, and institutional finance.
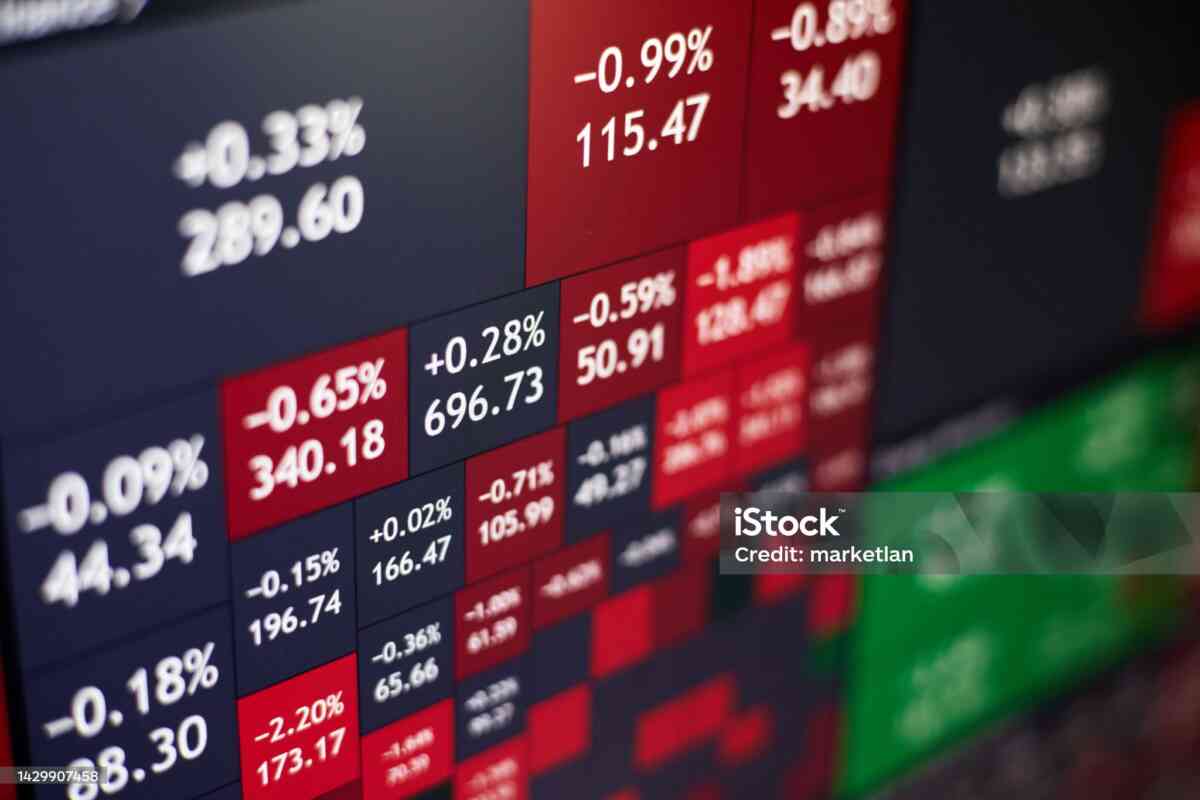
A stock heatmap monitor transforms massive amounts of market data into color-coded visual displays. Traders can instantly see which sectors are strong, weak, overbought, oversold, or experiencing unusual activity.
But heatmaps are evolving rapidly.
Artificial intelligence, machine learning, cloud computing, and big data analytics are transforming the future of heatmap technology. Modern heatmaps are no longer simple visual tools. They are becoming intelligent market analysis systems capable of detecting trends, predicting market behavior, and assisting traders in real time.
This article explores:
- The evolution of stock heatmap monitors
- AI integration in trading visualization
- Real-time market analytics
- Institutional trading applications
- Predictive heatmaps
- Future financial visualization technologies
- Risks and challenges of AI-driven heatmaps
The Evolution of Stock Heatmap Monitors
Early stock market analysis relied heavily on:
- Printed newspapers
- Ticker tapes
- Numerical tables
- Manual chart drawing
As computers became more powerful, digital trading platforms emerged.
The first heatmaps were relatively simple:
- Static displays
- Delayed data
- Limited customization
Modern heatmaps are vastly more advanced.
Today’s systems include:
- Real-time streaming data
- Interactive dashboards
- AI analytics
- Cross-market integration
- Predictive modeling
Heatmaps evolved because traders needed faster ways to process increasingly complex information.
Why Visual Analysis Matters
The human brain processes visual information much faster than text.
Heatmaps simplify complexity by converting numbers into patterns.
Instead of reading:
- Thousands of ticker symbols
- Price changes
- Sector tables
Traders can immediately recognize:
- Bullish sectors
- Bearish pressure
- Capital rotation
- Momentum clusters
This improves:
- Speed
- Focus
- Situational awareness
The Rise of Real-Time Market Monitoring
Modern financial markets move incredibly fast due to:
- Algorithmic trading
- High-frequency trading
- AI systems
- Global news distribution
Real-time monitoring is now essential.
A delayed reaction can result in:
- Missed opportunities
- Increased losses
- Poor execution
Real-time stock heatmaps allow traders to react instantly to:
- Breaking news
- Earnings reports
- Interest rate decisions
- Geopolitical events
AI Integration in Heatmap Technology
Artificial intelligence is transforming stock heatmaps into intelligent trading assistants.
AI systems can analyze:
- Historical price data
- Volume patterns
- Market sentiment
- News articles
- Social media discussions
- Correlation structures
This creates smarter heatmap systems capable of:
- Pattern recognition
- Risk detection
- Opportunity forecasting
Machine Learning and Pattern Recognition
Machine learning algorithms can identify recurring market patterns.
Examples include:
- Breakout formations
- Sector rotations
- Volatility spikes
- Panic selling
AI heatmaps may eventually recognize patterns before human traders notice them.
Predictive Heatmaps
Traditional heatmaps are reactive.
They show what is happening now.
Predictive heatmaps aim to forecast future conditions.
These systems may estimate:
- Potential sector strength
- Momentum continuation
- Volatility expansion
- Liquidity shifts
Predictive analysis could become one of the most important innovations in trading technology.
Institutional Use of Advanced Heatmaps
Large financial institutions use sophisticated heatmap systems integrated with:
- AI analytics
- Risk engines
- Portfolio optimization software
- Economic models
Institutions analyze:
- Cross-market correlations
- Capital flow
- Global macro trends
- Derivatives positioning
Institutional heatmaps are often far more complex than retail versions.
Heatmaps and Big Data
Financial markets generate enormous data streams.
Big data technologies allow heatmaps to process:
- Millions of trades
- News feeds
- Social sentiment
- Economic indicators
Cloud computing enables faster analysis across multiple markets simultaneously.
Social Media Sentiment Heatmaps
Modern AI systems increasingly analyze:
- Financial news
- Online forums
- Social media platforms
Sentiment heatmaps may display:
- Fear levels
- Bullish optimism
- Retail investor enthusiasm
This became especially important during meme stock events.
Heatmaps in High-Frequency Trading
High-frequency trading firms use advanced visualization tools for:
- Liquidity analysis
- Order flow tracking
- Arbitrage opportunities
Even milliseconds matter in these environments.
AI-enhanced heatmaps improve execution speed.
Sector Rotation Intelligence
Sector rotation is critical in professional investing.
AI heatmaps can identify:
- Early institutional accumulation
- Defensive sector migration
- Risk-on transitions
- Inflation-sensitive movements
This provides traders with major strategic advantages.
Cross-Market Heatmap Integration
Future heatmaps may combine:
- Stocks
- Bonds
- Forex
- Commodities
- Cryptocurrencies
Integrated analysis helps traders understand global capital movement.
For example:
- Rising oil prices may strengthen energy stocks.
- Falling bond yields may support technology growth stocks.
Cross-market analysis is becoming increasingly important.
Cryptocurrency Heatmaps
Cryptocurrency markets heavily rely on heatmaps because:
- Markets trade 24/7
- Volatility is extreme
- Thousands of coins exist
Crypto heatmaps help traders identify:
- Capital rotation
- Altcoin momentum
- Bitcoin dominance
- Panic selling
AI integration is especially valuable in crypto markets due to rapid price swings.
Risk Management Applications
Heatmaps improve risk management by identifying:
- Correlation risk
- Sector concentration
- Volatility spikes
- Liquidity problems
AI systems may eventually predict:
- Flash crashes
- Market instability
- Liquidity breakdowns
Personalized AI Heatmaps
Future platforms may become highly personalized.
AI could adapt heatmaps based on:
- Trading style
- Portfolio structure
- Risk tolerance
- Historical behavior
Each trader may see a customized market dashboard.
Voice-Controlled Market Visualization
Voice technology may become integrated into trading systems.
Traders could ask:
- “Show strongest sectors today.”
- “Highlight unusual volume.”
- “Display high-momentum growth stocks.”
This may dramatically improve efficiency.
Virtual Reality Trading Environments
Future financial visualization could include:
- 3D heatmaps
- Immersive dashboards
- Virtual trading rooms
Large institutions are already experimenting with advanced visualization systems.
The Role of Automation
AI-driven automation may:
- Generate trade alerts
- Suggest opportunities
- Identify anomalies
- Monitor risk continuously
Automation could reduce emotional trading mistakes.
Challenges and Risks of AI Heatmaps
Despite their advantages, AI heatmaps also create risks.
Overdependence on AI
Traders may become overly reliant on automation.
Human judgment remains important.
False Signals
AI systems can misinterpret unusual market events.
Unexpected news may invalidate predictive models.
Data Quality Problems
Poor data quality can produce:
- Incorrect analysis
- False alerts
- Misleading patterns
Reliable data remains critical.
Information Overload
Too much visualization can overwhelm traders.
Effective design remains essential.
Ethical and Regulatory Concerns
AI trading systems raise concerns about:
- Market fairness
- Transparency
- Manipulation
- Systemic risk
Governments and regulators are increasingly monitoring AI-driven financial systems.
How Retail Traders Benefit from Advanced Heatmaps
Retail traders now have access to tools once reserved for institutions.
Modern platforms offer:
- Real-time heatmaps
- AI scanning
- Mobile dashboards
- Cloud synchronization
Technology is leveling the playing field.
Educational Benefits
Heatmaps also improve financial education.
Beginners can better understand:
- Market structure
- Sector behavior
- Capital flow
- Correlation
Visualization accelerates learning.
The Psychology of Visual Trading
Visual systems reduce mental fatigue.
Heatmaps improve:
- Decision speed
- Pattern recognition
- Market awareness
This psychological edge can improve trading performance.
The Future of Financial Visualization
The future of financial analysis will likely become:
- More visual
- More predictive
- More interactive
- More personalized
AI will continue reshaping how traders interact with financial markets.
Conclusion
Stock Heatmap Monitors have evolved from simple visualization tools into sophisticated market intelligence systems. They provide traders and investors with rapid insight into market behavior, sector strength, capital flow, and trading opportunities.
As artificial intelligence, machine learning, and real-time analytics continue advancing, heatmaps will become even more powerful. Future systems may predict market movements, personalize analysis, automate risk management, and integrate global financial data into immersive visual environments.
However, successful trading will still depend on:
- Discipline
- Risk management
- Strategy
- Emotional control
Heatmaps are powerful tools, but they work best when combined with sound trading principles and critical thinking.
The financial world is becoming increasingly data-driven, and traders who understand advanced visualization technology will likely hold a significant advantage in the markets of the future.