tina hils
Introduction
Financial markets and the global economy are constantly changing. Stock indexes rise and fall every minute, currencies fluctuate based on economic news, oil prices react to geopolitical tensions, and businesses adapt to changing consumer demand. In this environment, having access to accurate and real-time information is critical.
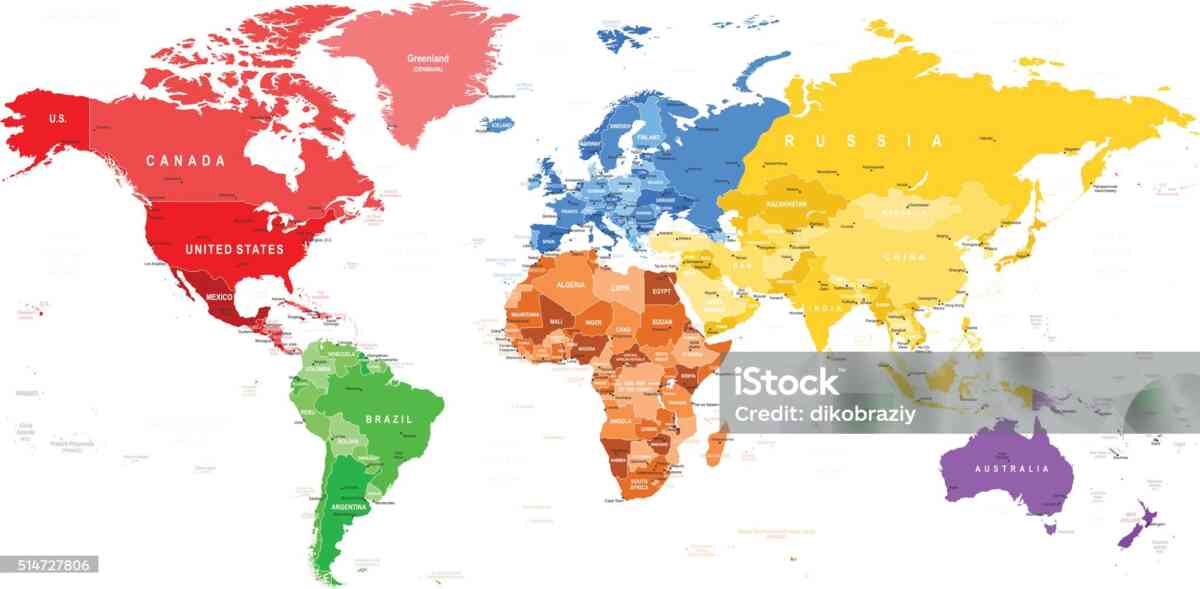
One of the most powerful tools used today is the Global Economic Map Monitor. These monitoring systems combine economic data, financial indicators, trade activity, and market analytics into interactive dashboards and visual maps. They provide users with a complete overview of global economic conditions and help them make better decisions.
Investors, traders, multinational corporations, governments, economists, and even small business owners now depend on economic monitoring platforms to track economic trends and identify opportunities and risks.
This article explains how Global Economic Map Monitors work and how they help investors, traders, and businesses succeed in the increasingly interconnected world economy.
The Modern Need for Real-Time Economic Monitoring
In earlier decades, economic information was slow. Reports were published monthly or quarterly, and businesses often reacted too late to economic changes.
Today, the global economy moves at incredible speed.
A single event can trigger worldwide consequences within hours:
- Central bank decisions affect global currencies
- Oil supply disruptions influence inflation worldwide
- Political instability impacts investor confidence
- Supply chain disruptions affect manufacturing globally
Modern investors and businesses cannot wait weeks for economic reports. They require real-time analysis and visual monitoring systems that simplify decision-making.
Global Economic Map Monitors solve this problem by providing live economic intelligence.
Understanding the Structure of a Global Economic Map Monitor
A typical monitoring system combines multiple components into one platform.
Data Sources
Economic monitors gather information from:
- Central banks
- Government statistical agencies
- Financial exchanges
- Commodity markets
- International organizations
- Shipping networks
- News agencies
The system processes this information continuously.
Visualization Tools
The collected data is displayed using:
- Interactive maps
- Charts
- Heatmaps
- Trend indicators
- Economic dashboards
Visual presentation makes economic information easier to understand quickly.
Analytical Systems
Advanced monitors also include:
- AI forecasting
- Risk scoring
- Economic trend analysis
- Predictive modeling
These systems help users anticipate future developments rather than simply observing current conditions.
How Investors Use Global Economic Map Monitors
Investors use economic monitoring systems to identify profitable opportunities and reduce financial risk.
Identifying Strong Economies
Investors often allocate capital to countries with:
- Strong GDP growth
- Stable inflation
- Healthy employment
- Political stability
Global economic maps make these trends visible instantly.
For example:
- Fast-growing Asian economies may attract technology investments
- Commodity-exporting countries may benefit during resource booms
- Low-debt economies may appear safer during crises
Sector Rotation Strategies
Different economic environments favor different industries.
Economic monitors help investors determine which sectors may outperform.
Examples include:
- Rising interest rates may benefit banks
- Falling energy prices may support airlines
- Economic recovery may boost industrial companies
- Inflation may increase demand for commodities
Monitoring economic conditions globally allows investors to shift portfolios strategically.
Monitoring Risk
Investors constantly monitor risks such as:
- Inflation spikes
- Debt crises
- Currency instability
- Geopolitical conflict
- Recession warnings
Global monitoring tools provide early warning signals that allow investors to protect capital.
Forex Traders and Currency Analysis
The forex market is one of the largest financial markets in the world. Currency values are heavily influenced by economic conditions.
Global Economic Map Monitors are essential tools for forex traders.
Interest Rate Monitoring
Interest rates strongly influence currency strength.
Higher interest rates often attract foreign capital, strengthening currencies.
Forex traders monitor:
- Central bank meetings
- Interest rate forecasts
- Inflation trends
Economic maps help traders compare monetary policy across countries.
Inflation Analysis
High inflation may weaken currencies if central banks fail to control it.
Forex traders track inflation globally to identify potential currency movements.
Economic Strength Comparison
Currency values depend on relative economic performance.
Traders compare:
- GDP growth
- Employment data
- Manufacturing activity
- Trade balances
A strong economy often supports a stronger currency.
Role in Stock Market Analysis
Stock investors rely heavily on economic monitoring.
Market Sentiment Tracking
Economic dashboards often display:
- Fear indexes
- Market volatility
- Investor sentiment
- Capital flows
These indicators help investors understand overall market mood.
Global Correlations
Modern stock markets are interconnected.
A recession in one region may affect global stock performance.
Economic monitors help investors track:
- International market correlations
- Sector performance globally
- Commodity-linked stock trends
Earnings and Economic Cycles
Corporate profits often depend on economic conditions.
Investors monitor:
- Consumer spending
- Manufacturing growth
- Employment trends
- Credit availability
Economic maps help forecast which industries may experience stronger earnings growth.
Commodity Traders and Global Monitoring
Commodity markets depend heavily on global economic conditions.
Oil Market Monitoring
Oil prices react to:
- Geopolitical conflict
- Production cuts
- Economic growth
- Transportation demand
Global economic maps help traders monitor these factors.
Agricultural Commodities
Food commodity prices depend on:
- Weather
- Trade conditions
- Currency fluctuations
- Fertilizer costs
Monitoring systems integrate these variables into comprehensive dashboards.
Precious Metals
Gold and silver prices often rise during economic uncertainty.
Commodity traders monitor:
- Inflation
- Interest rates
- Financial instability
- Currency weakness
Economic monitoring tools simplify this analysis.
How Businesses Use Global Economic Map Monitors
Businesses increasingly rely on global economic intelligence.
International Expansion Planning
Companies use economic data to identify attractive markets.
Factors include:
- Population growth
- Consumer purchasing power
- Economic stability
- Infrastructure quality
Interactive maps allow businesses to compare regions easily.
Supply Chain Monitoring
Global supply chains are vulnerable to disruption.
Businesses monitor:
- Shipping congestion
- Fuel prices
- Manufacturing conditions
- Trade restrictions
Economic monitoring helps companies avoid supply chain problems.
Currency Risk Management
Multinational companies face currency exposure.
Economic dashboards help businesses manage:
- Exchange rate volatility
- Inflation risk
- Interest rate changes
This supports better financial planning.
Economic Crisis Detection
Global Economic Map Monitors help detect early warning signs of crises.
Recession Indicators
Common recession signals include:
- Declining manufacturing activity
- Falling consumer confidence
- Rising unemployment
- Yield curve inversions
Monitoring systems track these indicators globally.
Debt Risks
Excessive government or corporate debt may create financial instability.
Economic maps visualize debt levels by country and region.
Banking System Stress
Some advanced monitors track:
- Bank liquidity
- Credit conditions
- Bond spreads
These indicators help detect financial system stress early.
Artificial Intelligence and Predictive Analytics
AI is transforming economic monitoring dramatically.
Pattern Recognition
AI systems identify hidden economic relationships that humans may overlook.
Predictive Forecasting
Machine learning models forecast:
- GDP growth
- Inflation
- Commodity demand
- Currency movements
News and Sentiment Analysis
AI monitors news articles, social media, and economic reports to evaluate market sentiment automatically.
Importance During Global Crises
Economic monitoring became especially important during major global crises.
COVID-19 Pandemic
During the pandemic, economic monitors tracked:
- Supply chain disruptions
- Lockdowns
- Employment losses
- Government stimulus programs
Real-time data helped governments and businesses respond quickly.
Energy Crises
Global energy shortages affect inflation and industrial production.
Monitoring systems track:
- Oil supply
- Natural gas prices
- Electricity demand
- Energy exports
Geopolitical Conflicts
Wars and sanctions create global economic uncertainty.
Economic maps help users monitor:
- Trade disruptions
- Commodity shortages
- Currency impacts
- Financial sanctions
Benefits of Visualization
One major advantage of Global Economic Map Monitors is visualization.
Visual dashboards simplify complex data by showing:
- Color-coded trends
- Regional economic performance
- Global market relationships
- Real-time movement patterns
Visualization improves decision-making speed and clarity.
Future of Economic Monitoring Technology
The future will likely include:
- Satellite economic activity tracking
- AI-driven forecasting systems
- Blockchain data verification
- Climate-economic monitoring
- Real-time trade flow analysis
- Automated investment intelligence
Economic monitoring systems will continue becoming faster and more accurate.
Conclusion
Global Economic Map Monitors are transforming the way investors, traders, and businesses analyze the world economy. By combining real-time data, advanced analytics, and interactive visualizations, these systems provide powerful insight into economic conditions and financial markets.
Investors use them to identify profitable opportunities. Traders rely on them to track market-moving events. Businesses use them for expansion planning, supply chain management, and risk reduction. Governments use them to develop economic policy and monitor financial stability.
In an increasingly interconnected global economy, understanding worldwide economic trends is essential. Global Economic Map Monitors provide the tools needed to navigate this complexity and make informed decisions in real time.

