
Kelly stewart
Introduction
Trading financial markets successfully requires more than luck. Professional traders rely on data, analysis, market structure, and visual tools to identify profitable opportunities. One of the most effective modern trading tools is the Stock Heatmap Monitor.
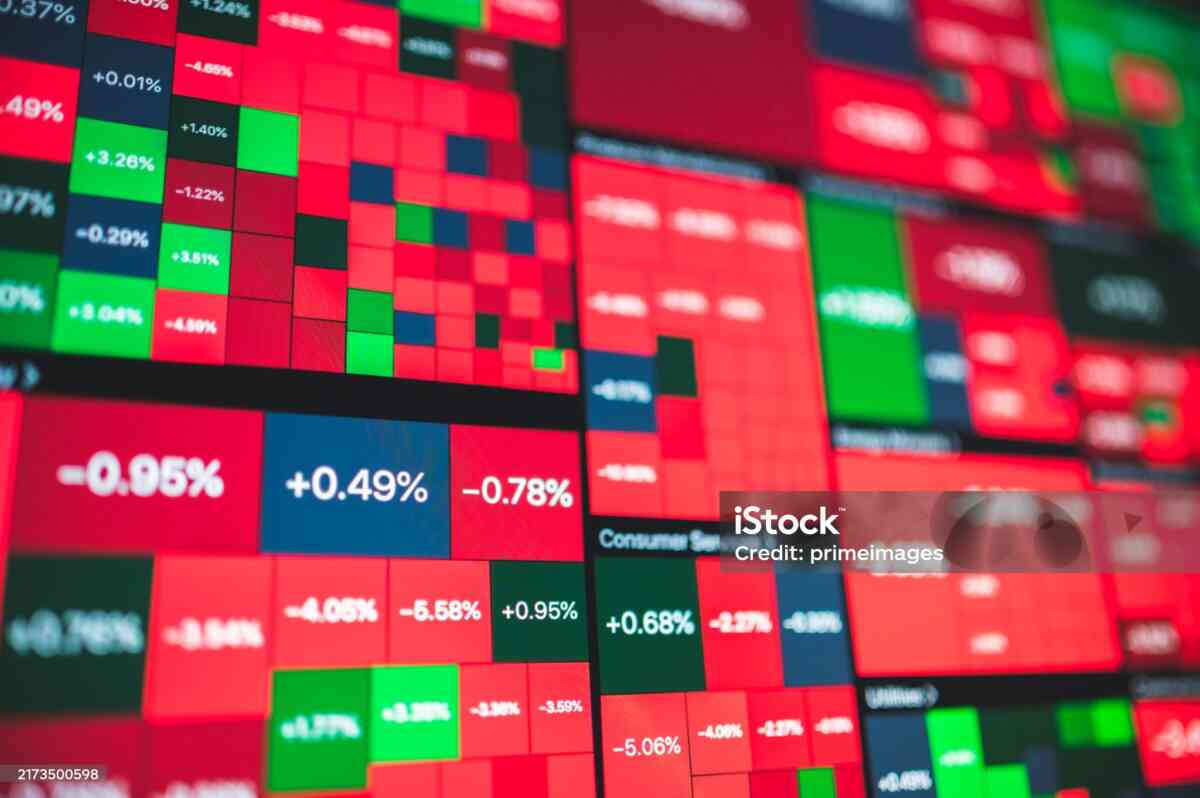
A stock heatmap monitor provides traders with a visual overview of the market by displaying stocks as color-coded blocks. Instead of analyzing endless lists of symbols, traders can instantly identify strong sectors, weak sectors, unusual volume activity, and overall market sentiment.
The popularity of stock heatmaps has grown dramatically in recent years because markets now move faster than ever. Artificial intelligence, algorithmic trading, high-frequency trading, and global economic events create rapid changes across financial markets. Traders need tools that simplify large amounts of data into actionable insights.
This article explains how traders can use stock heatmap monitors effectively for:
- Day trading
- Swing trading
- Long-term investing
- Sector rotation analysis
- Risk management
- Portfolio monitoring
We will also explore advanced trading techniques using heatmaps and common mistakes traders should avoid.
Understanding Market Visualization
Humans process visual information much faster than numerical information.
Traditional stock scanners often display:
- Price
- Volume
- Percentage change
- Market cap
- Volatility
While useful, numerical tables can become overwhelming.
Heatmaps solve this problem by converting data into visual patterns.
Traders can instantly recognize:
- Bullish sectors
- Bearish sectors
- Market leaders
- Market laggards
- Capital flow
This is why many professional trading desks rely heavily on heatmap visualization systems.
Reading a Stock Heatmap Correctly
To use a stock heatmap effectively, traders must understand how to interpret its components.
Color Interpretation
Colors indicate performance.
Green
- Positive movement
- Bullish momentum
- Buying pressure
Red
- Negative movement
- Selling pressure
- Bearish conditions
Neutral
- Low volatility
- Sideways movement
Size Interpretation
Tile size usually reflects:
- Market capitalization
- Trading volume
- Portfolio weighting
Large tiles often represent influential companies.
Example:
- Apple
- Microsoft
- Amazon
- Tesla
Sector Organization
Most heatmaps organize stocks into sectors.
This allows traders to compare industry performance instantly.
For example:
- Technology may be strongly bullish.
- Utilities may be weak.
- Energy may show sudden momentum.
Using Heatmaps for Day Trading
Day traders need speed.
A stock heatmap monitor provides immediate information about:
- Opening momentum
- Volume surges
- Intraday reversals
- Sector strength
Morning Market Analysis
The first hour after market open is extremely important.
Day traders use heatmaps to identify:
- Gap-up stocks
- Gap-down stocks
- Strong sectors
- Weak sectors
If most technology stocks are green during the open, traders may prioritize long opportunities within that sector.
Momentum Trading with Heatmaps
Momentum traders look for stocks moving strongly in one direction.
Heatmaps help identify:
- Stocks outperforming the market
- Strong relative strength
- High-volume breakouts
Momentum traders often combine heatmaps with:
- Volume indicators
- VWAP
- Moving averages
- Level 2 data
Sector Rotation Trading
Sector rotation is one of the most powerful concepts in trading.
Money constantly moves between industries depending on:
- Economic conditions
- Interest rates
- Inflation
- Geopolitical events
Heatmaps make sector rotation visually obvious.
Example:
- Energy stocks turn green.
- Technology stocks turn red.
This may indicate institutions shifting capital.
Swing Trading Strategies Using Heatmaps
Swing traders focus on multi-day or multi-week moves.
Heatmaps help swing traders identify:
- Emerging trends
- Relative strength sectors
- Institutional accumulation
Finding Strong Stocks in Strong Sectors
One classic strategy is:
- Buy strong stocks in strong sectors.
- Avoid weak stocks in weak sectors.
Heatmaps simplify this process dramatically.
Relative Strength Analysis
Relative strength measures how well a stock performs compared to:
- The market
- Its sector
- Competitors
Heatmaps help traders identify outperformers quickly.
Using Heatmaps for Portfolio Management
Investors use heatmaps to visualize portfolio exposure.
This helps identify:
- Overconcentration
- Sector imbalance
- Correlation risk
Diversification Analysis
A diversified portfolio should not depend heavily on one industry.
Heatmaps quickly reveal:
- Sector dominance
- Hidden concentration risk
Monitoring Portfolio Performance
Portfolio heatmaps display:
- Winning positions
- Losing positions
- Daily changes
- Risk exposure
This provides much faster understanding than spreadsheets.
Heatmaps and Market Psychology
Markets are heavily influenced by emotion.
Heatmaps visually display:
- Fear
- Greed
- Panic
- Euphoria
A fully red market often reflects fear-driven selling.
A fully green market often reflects aggressive buying optimism.
Combining Heatmaps with Technical Indicators
Heatmaps become even more powerful when combined with technical analysis.
Common combinations include:
- RSI
- MACD
- Bollinger Bands
- Moving averages
- Fibonacci retracements
Heatmaps identify where traders should focus attention.
Technical indicators provide trade confirmation.
Using Volume with Heatmaps
Volume is extremely important.
A strong move with low volume may fail.
A strong move with high volume is often more reliable.
Volume heatmaps help traders identify:
- Institutional activity
- Breakouts
- Reversals
Pre-Market and After-Hours Analysis
Modern heatmap platforms often include:
- Pre-market trading
- After-hours trading
This helps traders prepare for:
- Earnings releases
- Economic reports
- Overnight news
Heatmaps and Algorithmic Trading
Algorithmic trading systems also use heatmap logic.
AI systems analyze:
- Correlations
- Sector strength
- Momentum clusters
- Liquidity
Professional hedge funds use advanced visual analytics extensively.
Best Features to Look for in a Heatmap Platform
A high-quality stock heatmap monitor should include:
Real-Time Updates
Fast updates are critical.
Sector Filters
Traders should isolate sectors quickly.
Volume Analysis
Volume confirms price movement.
Multi-Timeframe Analysis
Useful for both short-term and long-term traders.
Watchlist Integration
Allows traders to monitor favorite stocks easily.
Mobile Compatibility
Modern traders need access everywhere.
Common Heatmap Trading Mistakes
Chasing Green Stocks
A stock that already moved strongly may reverse.
Ignoring Risk Management
Heatmaps do not replace stop-loss discipline.
Overtrading
Too much information can lead to excessive trades.
Ignoring Market Context
Economic conditions still matter.
Psychological Benefits of Heatmaps
Heatmaps reduce cognitive overload.
Benefits include:
- Faster recognition
- Better focus
- Reduced confusion
- Improved decision-making
This psychological advantage is extremely important during volatile markets.
How Beginners Should Start Using Heatmaps
Start Simple
Focus first on:
- Sector strength
- Major movers
- Market direction
Combine with Basic Technical Analysis
Learn support and resistance.
Use Paper Trading
Practice before risking real money.
Review Historical Heatmaps
Study how markets behaved during:
- Crashes
- Rallies
- Earnings seasons
Future Trends in Heatmap Technology
Future stock heatmaps may include:
- AI predictions
- Voice-controlled interfaces
- Smart alerts
- 3D visualization
- Virtual reality trading environments
Technology will continue transforming trading visualization.
Heatmaps in Cryptocurrency Trading
Crypto traders heavily use heatmaps because:
- Crypto markets move rapidly.
- Volatility is extremely high.
Crypto heatmaps help traders identify:
- Altcoin momentum
- Bitcoin dominance shifts
- Market-wide panic
- Liquidity movement
Heatmaps in Global Markets
Heatmaps are also useful for:
- International stock markets
- Commodities
- Forex
- Bonds
Global investors use multi-market heatmaps to understand worldwide capital flow.
Conclusion
A Stock Heatmap Monitor is one of the most valuable tools for modern traders and investors. It simplifies complex market data into intuitive visual patterns that improve speed, clarity, and market awareness.
Whether used for day trading, swing trading, portfolio management, or sector rotation analysis, heatmaps provide powerful insights into market behavior.
However, successful trading still requires:
- Discipline
- Risk management
- Technical analysis
- Emotional control
Heatmaps are not magic prediction machines, but when used properly, they can dramatically improve a trader’s ability to recognize opportunities and avoid unnecessary risk.
As financial markets continue evolving, stock heatmap technology will become increasingly advanced, intelligent, and essential for market participants around the world.

