amber rose
Introduction
Technology has changed the way people interact with financial markets. Traders no longer rely solely on newspapers or delayed television reports. Today, live market information is available instantly through Custom Real-Time Charts.
These charts provide dynamic visual updates for stocks, forex, cryptocurrencies, commodities, and many other assets. They help traders identify trends, monitor volatility, and make informed decisions faster than ever before.
Custom real-time charting platforms have become essential tools for:
- Traders
- Investors
- Analysts
- Financial bloggers
- Businesses
- Fintech companies
Whether you are a beginner learning technical analysis or a professional managing large investments, understanding real-time charts is extremely important.
Understanding Real-Time Charting
A real-time chart continuously updates whenever new market data becomes available.
Unlike traditional charts that refresh manually, modern real-time systems automatically stream live information.
What Real-Time Charts Display
Typical live chart data includes:
- Asset prices
- Trading volume
- Bid and ask prices
- Market volatility
- Technical indicators
- Economic announcements
Why Customization Matters
Every trader has different goals and strategies.
Customization allows users to create personalized trading environments.
Common Custom Features
- Adjustable timeframes
- Indicator templates
- Chart themes
- Alerts
- Multi-screen layouts
- Drawing tools
Customized charts improve efficiency and reduce distractions.
Main Types of Real-Time Charts
Candlestick Charts
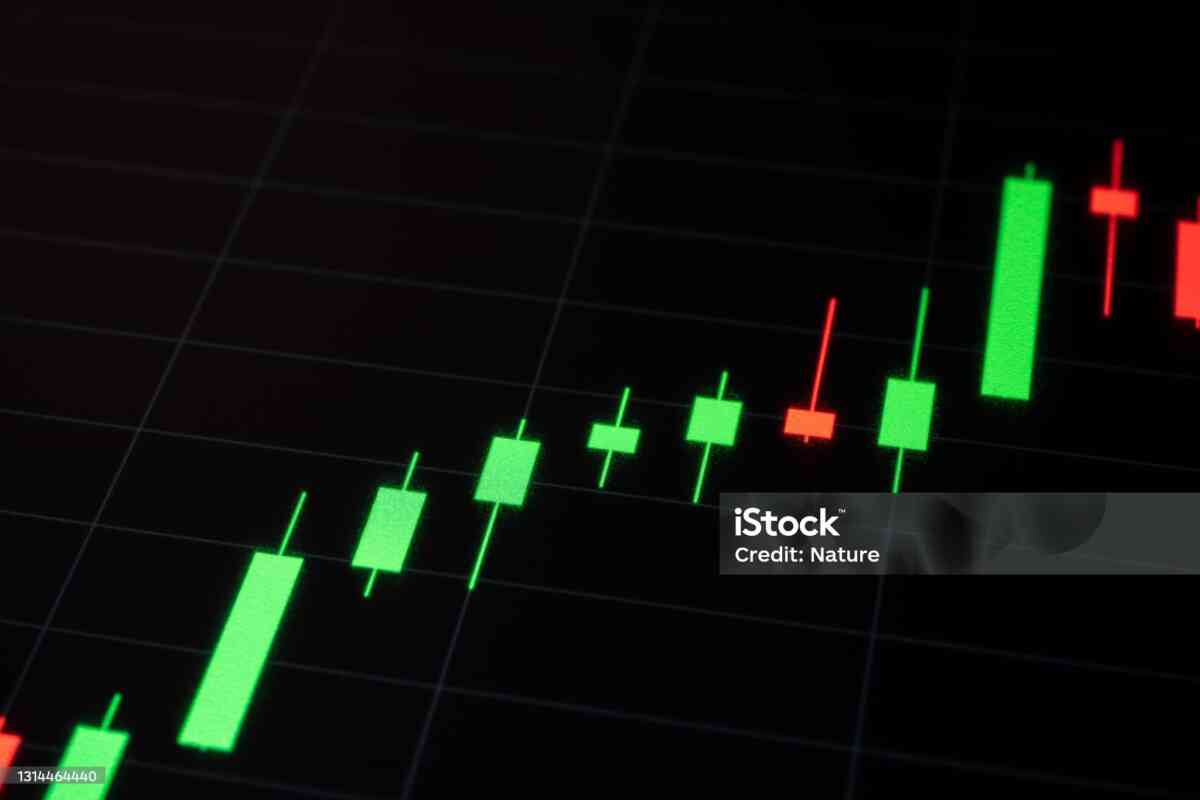
Candlestick charts dominate modern trading.


Traders use candlesticks to analyze:
- Momentum
- Reversals
- Support levels
- Resistance zones
Line Charts
Line charts are clean and simple.


Best for:
- Long-term investors
- Beginners
- Market summaries
Bar Charts
Bar charts provide detailed pricing structure.


Key Features of Modern Chart Platforms
Live Data Streaming
Instant updates improve reaction speed.
Technical Indicators
Platforms offer indicators like:
- RSI
- MACD
- EMA
- SMA
- Bollinger Bands
Cross-Platform Compatibility
Charts work on:
- Desktop
- Mobile
- Tablet
Alert Systems
Notifications help traders monitor markets efficiently.
Real-Time Charts in Cryptocurrency Markets
Crypto markets operate 24 hours daily.
Why Real-Time Data Matters in Crypto
- High volatility
- Rapid price swings
- Global participation
- Constant news impact


Forex Trading and Live Charts
Forex traders use live charts to monitor currency fluctuations.
Forex Chart Benefits
- Economic event tracking
- Session analysis
- Scalping support
- Trend identification
Major pairs include:
- EUR/USD
- GBP/USD
- USD/CAD
- USD/JPY
Stock Market Applications
Real-time stock charts help traders analyze:
- Earnings reactions
- Institutional volume
- Sector performance
- Intraday movement


AI and Automation in Charting
Artificial intelligence improves market analysis dramatically.
AI Capabilities
- Pattern recognition
- Predictive forecasting
- Smart alerts
- Sentiment analysis
- Automated trading
AI tools help traders reduce emotional decision-making.
Technologies Powering Real-Time Charts
APIs
APIs provide market data from exchanges.
WebSockets
Enable fast live updates.
Cloud Systems
Improve scalability and uptime.
JavaScript Libraries
Popular libraries include:
- D3.js
- Chart.js
- Highcharts
- TradingView Widgets
Mobile Real-Time Trading
Mobile trading apps are increasingly popular.
Mobile Features
- Push alerts
- Live watchlists
- Fast execution
- Cloud sync
Traders can monitor markets from anywhere.
Common Challenges
Latency Problems
Internet speed affects chart performance.
Data Overload
Too many indicators create confusion.
Subscription Costs
Premium live data feeds can be expensive.
Emotional Trading
Constant market monitoring may increase stress.
Tips for Beginners
Start Simple
Use only a few indicators initially.
Learn Candlestick Patterns
Mastering patterns improves analysis.
Use Risk Management
Never risk too much capital.
Practice on Demo Accounts
Build experience safely.
Example of Live Market Trend Analysis
Future of Real-Time Chart Technology
The next generation of charting systems may include:
- AI-generated trade setups
- Voice assistants
- Virtual reality trading rooms
- Blockchain-based analytics
- Predictive market modeling
These technologies will further improve decision-making speed and accuracy.
SEO Value of Real-Time Chart Websites
Financial chart websites attract valuable traffic because they target high CPC keywords.
Benefits for Publishers
- Strong advertising revenue
- Long visitor duration
- High engagement
- Repeat traffic
- Premium affiliate opportunities
Conclusion
Custom Real-Time Charts are among the most important tools in modern finance. They provide instant access to live market information and help users make better trading and investment decisions.
Whether used for stocks, forex, cryptocurrencies, or business analytics, real-time charts continue transforming how people analyze data and interact with markets.
As artificial intelligence and cloud technology evolve, charting platforms will become even more powerful, intelligent, and accessible for users worldwide.

