Kelly stewart
Introduction
Financial markets move at incredible speed. Every second, millions of shares are traded across global stock exchanges, causing prices to rise and fall continuously. For traders and investors, monitoring these movements efficiently is one of the most important tasks in the market. Traditional watchlists and numerical tables are useful, but they can become overwhelming when analyzing hundreds or thousands of stocks simultaneously.
This is where the Stock Heatmap Monitor becomes one of the most powerful tools in modern trading and investing.
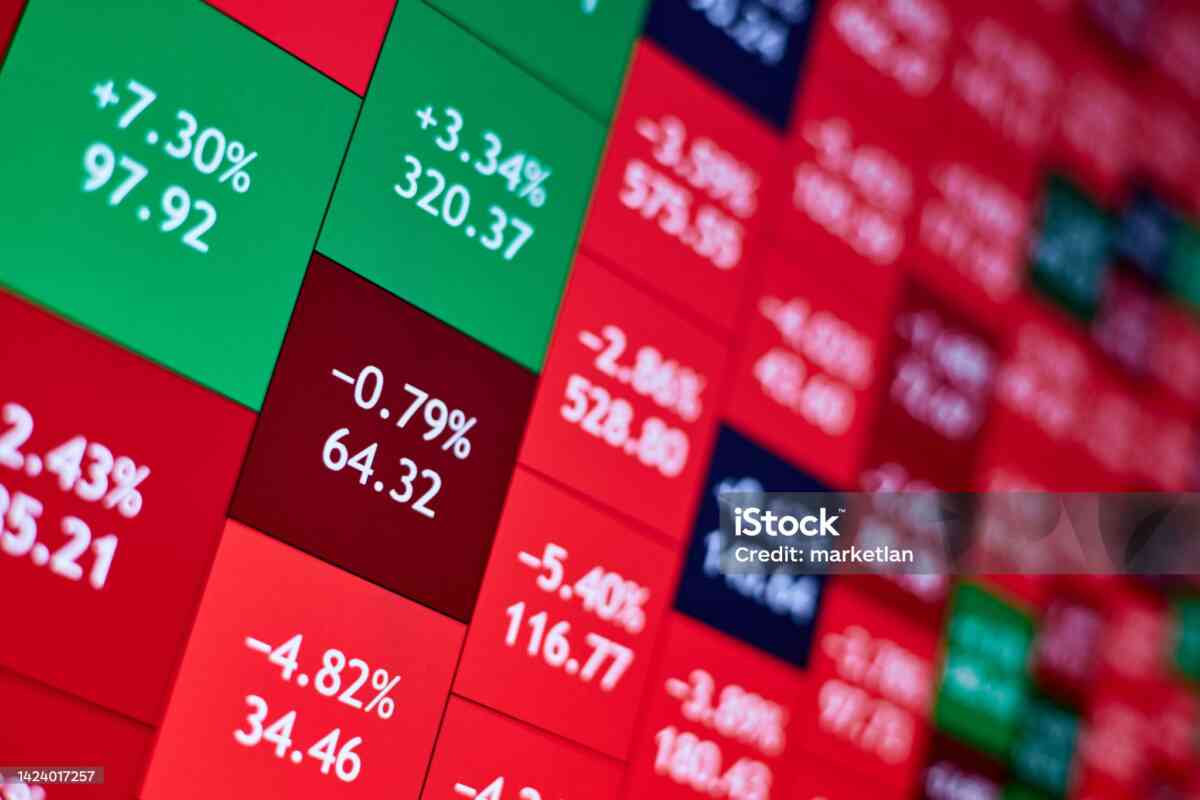
A Stock Heatmap Monitor is a visual representation of market performance where stocks are displayed as colored blocks. The size and color of each block usually represent factors such as market capitalization, price movement, trading volume, or sector performance. Green colors often indicate gains, while red colors indicate losses. Darker shades typically represent stronger price movements.
Stock heatmaps transform complicated market data into an easy-to-understand visual dashboard. Instead of reading long spreadsheets or analyzing endless price lists, traders can instantly identify which sectors are strong, weak, bullish, bearish, or experiencing unusual volatility.
Today, stock heatmap monitors are widely used by:
- Day traders
- Swing traders
- Institutional investors
- Portfolio managers
- Financial analysts
- Hedge funds
- Long-term investors
- Market educators
- Cryptocurrency traders
- Forex analysts
In this article, we will explore how stock heatmap monitors work, why they are important, how professional traders use them, their advantages and limitations, and how beginners can use them to improve trading decisions.
Understanding the Basics of a Stock Heatmap Monitor
A stock heatmap monitor is essentially a graphical market overview tool.
Instead of showing information in rows and columns, the monitor displays stocks as visual tiles or rectangles. Each tile contains information such as:
- Stock ticker
- Company name
- Percentage change
- Market sector
- Trading volume
- Market capitalization
The purpose is to provide a fast understanding of overall market conditions.
For example:
- Large green areas may indicate a bullish market.
- Large red areas may indicate panic selling.
- Sector concentration may reveal where institutional money is flowing.
Heatmaps simplify complex information through visual communication.
How Colors Work in Heatmaps
Colors are the core language of a stock heatmap monitor.
Green Colors
Green usually means:
- Positive price movement
- Bullish momentum
- Strong buying activity
The darker the green, the stronger the upward movement.
Example:
- Light green = +0.5%
- Medium green = +2%
- Dark green = +5%
Red Colors
Red usually means:
- Negative price movement
- Bearish momentum
- Selling pressure
The darker the red, the larger the decline.
Example:
- Light red = -0.5%
- Dark red = -6%
Neutral Colors
Gray or black often represent:
- Minimal price movement
- Stable stocks
- Low volatility
How Tile Size Works
The size of each rectangle often represents:
- Market capitalization
- Trading volume
- Portfolio weighting
- Liquidity
Large companies like Apple, Microsoft, or Amazon usually appear larger because they dominate market capitalization.
Smaller companies appear as smaller blocks.
This design allows traders to immediately understand which companies influence the market most heavily.
Types of Stock Heatmap Monitors
There are several different types of stock heatmaps available today.
Sector Heatmaps
Sector heatmaps group stocks by industry sectors such as:
- Technology
- Banking
- Healthcare
- Energy
- Consumer goods
- Utilities
- Industrials
These are extremely useful for identifying sector rotation.
Market Capitalization Heatmaps
These prioritize company size.
Large-cap stocks dominate the visual space, helping traders understand which companies are driving index movement.
Volume Heatmaps
Volume heatmaps emphasize trading activity.
Unusual volume often signals:
- Institutional buying
- Institutional selling
- Breakouts
- News events
- Earnings reactions
Performance Heatmaps
These focus purely on percentage gains and losses.
Traders use them to identify:
- Top gainers
- Top losers
- Momentum opportunities
Portfolio Heatmaps
Some investors use customized heatmaps to track personal portfolios.
These monitors help investors quickly visualize:
- Winning positions
- Losing positions
- Risk concentration
- Diversification balance
Why Traders Use Stock Heatmap Monitors
Faster Market Understanding
A heatmap allows traders to understand the market within seconds.
Without a heatmap:
- Traders must read tables.
- Scan charts individually.
- Analyze hundreds of tickers manually.
With a heatmap:
- Market strength becomes instantly visible.
Identifying Sector Rotation
Institutional investors often rotate money between sectors.
Example:
- Money exits technology stocks.
- Money enters energy stocks.
Heatmaps make this rotation obvious.
Sector rotation is one of the most important concepts in professional trading.
Detecting Market Sentiment
Heatmaps provide a visual representation of fear and greed.
A mostly green heatmap suggests:
- Bullish sentiment
- Risk-on environment
A mostly red heatmap suggests:
- Bearish sentiment
- Risk-off environment
Finding Trading Opportunities
Traders can quickly identify:
- Momentum stocks
- Oversold sectors
- Breakout candidates
- High-volume movers
How Institutional Traders Use Heatmaps
Large financial institutions use sophisticated heatmap systems integrated with:
- Real-time data feeds
- AI algorithms
- Risk analysis systems
- Portfolio management platforms
Institutional traders monitor:
- Capital flow
- Relative strength
- Correlation risk
- Sector leadership
- Volatility clusters
Heatmaps help institutions react faster than competitors.
Benefits of Using a Stock Heatmap Monitor
Visual Simplicity
Human brains process visual information faster than text.
Heatmaps reduce information overload.
Speed
In fast-moving markets, speed matters.
Heatmaps provide:
- Instant awareness
- Faster reactions
- Quick opportunity recognition
Better Risk Management
Traders can identify:
- Concentrated sector risk
- Correlated losses
- Market-wide weakness
Enhanced Strategy Development
Heatmaps improve:
- Swing trading
- Day trading
- Momentum investing
- Sector rotation investing
Common Features in Modern Heatmap Platforms
Modern stock heatmap monitors often include:
- Real-time updates
- Interactive zooming
- Sector filtering
- Watchlist integration
- News integration
- Volume analysis
- Timeframe customization
- Dark mode
- Multi-market support
Some advanced platforms also include AI-driven alerts.
Heatmaps and Technical Analysis
Stock heatmaps work extremely well with technical analysis.
Traders combine heatmaps with:
- Moving averages
- RSI
- MACD
- Fibonacci retracement
- Trendlines
- Support and resistance
Heatmaps help traders identify where technical setups are strongest.
Heatmaps in Day Trading
Day traders use heatmaps for:
- Pre-market scanning
- Opening momentum
- Intraday sector strength
- Volume spikes
- Reversal opportunities
During the first trading hour, heatmaps become especially powerful.
Heatmaps in Swing Trading
Swing traders use heatmaps to identify:
- Multi-day trends
- Sector leadership
- Relative strength stocks
- Rotation setups
Swing traders often look for strong sectors and buy leading stocks within those sectors.
Heatmaps in Long-Term Investing
Long-term investors use heatmaps differently.
They focus on:
- Portfolio balance
- Sector diversification
- Economic trends
- Market cycles
Heatmaps help investors avoid overexposure to one industry.
The Role of AI in Modern Heatmaps
Artificial intelligence is increasingly integrated into heatmap systems.
AI can:
- Detect unusual market activity
- Predict sector momentum
- Analyze sentiment
- Identify hidden correlations
Future heatmaps may become fully predictive rather than reactive.
Heatmaps Beyond Stocks
Heatmap technology is also used in:
- Cryptocurrency markets
- Forex markets
- Bond markets
- Commodity trading
- Real estate analytics
Crypto heatmaps are especially popular because of high volatility.
Common Mistakes When Using Heatmaps
Overreacting to Color
A bright green stock is not always a good buy.
Traders must still analyze:
- Fundamentals
- Technical structure
- Risk/reward ratio
Ignoring Context
Heatmaps only show movement, not reasons.
News events, earnings, or macroeconomic data must still be considered.
Trading Emotionally
Heatmaps can trigger emotional reactions.
Successful traders remain disciplined.
Best Practices for Using Heatmaps
Combine with Other Tools
Use heatmaps alongside:
- Charts
- News feeds
- Technical indicators
- Economic calendars
Focus on Relative Strength
Strong stocks in strong sectors often outperform.
Monitor Volume
Price movement without volume can be unreliable.
Use Multiple Timeframes
Short-term and long-term heatmaps provide different insights.
Future of Stock Heatmap Monitors
The future of stock heatmaps will likely include:
- AI automation
- Voice interaction
- Predictive analytics
- 3D visualization
- Personalized dashboards
- Cross-market integration
Financial visualization technology will continue evolving rapidly.
Conclusion
A Stock Heatmap Monitor is one of the most efficient tools for visualizing market activity. It transforms overwhelming financial data into an intuitive visual dashboard that traders and investors can understand instantly.
Whether used for day trading, swing trading, portfolio management, or institutional analysis, heatmaps provide critical advantages in speed, clarity, and market awareness.
Modern financial markets move quickly, and traders who can process information faster often gain a competitive edge. Heatmaps simplify complexity, reveal hidden market patterns, and improve decision-making across nearly every trading style.
As financial technology continues advancing, stock heatmap monitors will likely become even more intelligent, predictive, and essential for modern market participants.

