Kelly stewart
Introduction
Modern financial markets move faster than ever before. Traders and investors face overwhelming streams of information every second, including price fluctuations, volume changes, economic reports, earnings announcements, geopolitical developments, and institutional order flow.
To manage this complexity efficiently, professional traders increasingly rely on advanced visualization systems known as Stock Heatmap Monitors.
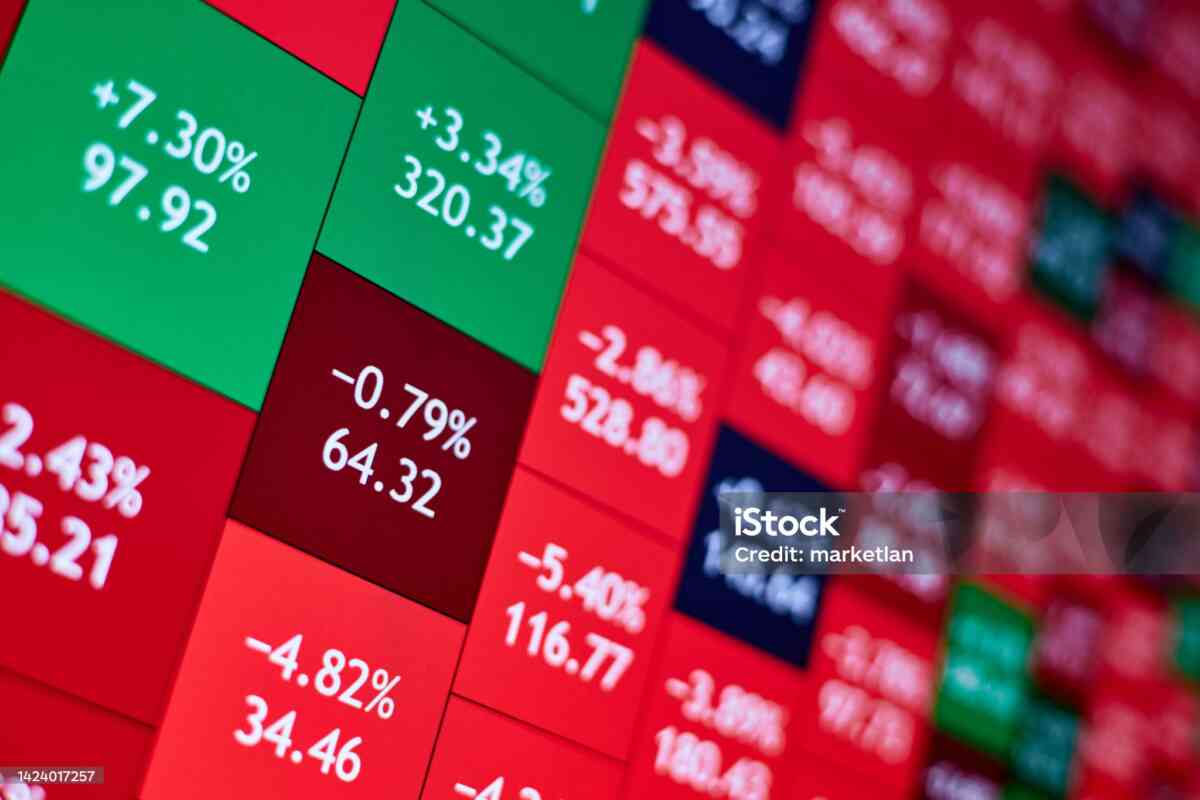
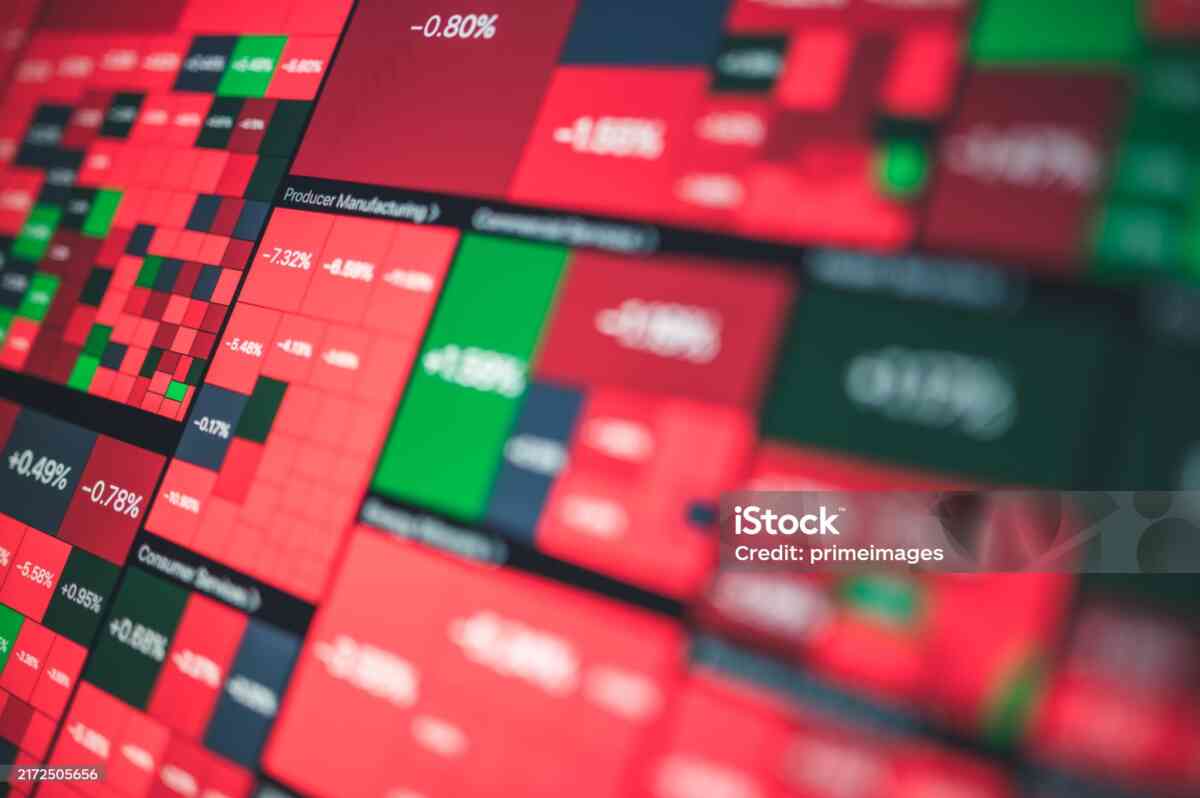
A Stock Heatmap Monitor transforms raw market data into a visual interface where colors, sizes, and groupings reveal market conditions instantly. Heatmaps allow traders to scan thousands of stocks quickly and identify opportunities, risks, trends, and sector movements in real time.
Heatmaps are now essential tools across:
- Stock markets
- Cryptocurrency exchanges
- Forex platforms
- Commodity trading desks
- Institutional investment firms
This article explores advanced Stock Heatmap Monitor strategies, professional applications, institutional techniques, and the future of visual market analytics.
Understanding Advanced Heatmap Structure
Basic heatmaps display simple price changes, but advanced heatmaps incorporate multiple layers of data simultaneously.
These may include:
- Price movement
- Relative strength
- Trading volume
- Volatility
- Options activity
- Institutional flow
- Market breadth
- Sentiment analysis
Professional traders often customize heatmaps to fit specific strategies.
Real-Time Market Intelligence
Speed is critical in modern markets.
Advanced heatmaps deliver:
- Instant market scanning
- Live sector updates
- Momentum detection
- Liquidity monitoring
Real-time intelligence helps traders react faster than traditional analysis methods.
Institutional Trading and Heatmaps
Institutional investors manage billions of dollars and require advanced monitoring systems.
Heatmaps help institutions:
- Analyze sector allocation
- Detect liquidity shifts
- Manage portfolio exposure
- Monitor systematic risk
Institutional dashboards may include:
- Multi-market heatmaps
- Correlation matrices
- Volatility overlays
- AI-generated signals
Sector Rotation Strategy
Sector rotation is one of the most powerful applications of heatmap analysis.
Institutional money flows between sectors based on:
- Economic cycles
- Interest rates
- Inflation trends
- Commodity prices
- Market sentiment
Heatmaps reveal these flows visually.
Examples:
- Technology strength during growth cycles
- Energy strength during oil rallies
- Defensive sectors during recessions
Traders who identify rotation early often gain significant advantages.
Market Breadth Analysis
Market breadth measures overall participation in market movement.
A strong market typically shows:
- Broad sector participation
- Strong advancing volume
- Multiple bullish industries
Weak breadth may indicate:
- Fragile rallies
- Institutional divergence
- Potential reversals
Heatmaps provide instant breadth visualization.
Relative Strength Analysis
Relative strength measures performance compared to the broader market.
Heatmaps help traders identify:
- Strong outperformers
- Weak underperformers
- Emerging leaders
Relative strength is widely used by:
- Swing traders
- Momentum traders
- Growth investors
Volatility Heatmaps
Volatility heatmaps highlight rapid price movement.
Professional traders monitor volatility for:
- Options pricing
- Risk management
- Breakout trading
- Scalping opportunities
Periods of high volatility often create:
- Greater opportunity
- Greater risk
- Increased emotional trading
Options Market Heatmaps
Some advanced systems visualize options activity.
These heatmaps display:
- Open interest
- Gamma exposure
- Unusual options volume
- Implied volatility
Options heatmaps help traders understand institutional positioning.
Dark Pool and Institutional Flow Monitoring
Advanced platforms sometimes integrate:
- Dark pool activity
- Block trades
- Institutional buying pressure
Large hidden orders can significantly influence market direction.
Heatmaps help identify:
- Accumulation
- Distribution
- Institutional momentum
AI and Machine Learning Integration
Artificial intelligence is transforming market visualization.
AI-powered heatmaps can:
- Detect hidden patterns
- Generate alerts
- Predict probability zones
- Identify anomalies
Machine learning systems improve continuously using historical market data.
Sentiment Heatmaps
Sentiment analysis combines:
- News data
- Social media trends
- Analyst opinions
- Market positioning
Sentiment heatmaps help traders measure:
- Fear
- Greed
- Optimism
- Panic
This improves timing and market awareness.
Cryptocurrency Heatmaps
Crypto markets are highly dynamic.
Crypto heatmaps track:
- Bitcoin dominance
- Altcoin rotations
- DeFi sectors
- Meme coin trends
- NFT-related tokens
Because crypto markets operate around the clock, heatmaps are especially useful.
Forex Currency Heatmaps
Forex traders rely heavily on currency strength heatmaps.
These visualize:
- USD strength
- EUR weakness
- JPY volatility
- Cross-pair momentum
Forex heatmaps improve:
- Pair selection
- Correlation analysis
- Relative strength trading
Heatmaps and Algorithmic Trading
Algorithms process massive amounts of information.
Heatmaps help traders supervise:
- Automated systems
- High-frequency activity
- Market structure changes
Professional firms integrate heatmap data into algorithmic models.
Portfolio Risk Heatmaps
Portfolio managers use heatmaps for risk visualization.
These may display:
- Sector concentration
- Geographic exposure
- Correlation risk
- Volatility clusters
Risk heatmaps improve:
- Diversification
- Capital preservation
- Exposure management
Earnings Season Heatmaps
Corporate earnings create major market movement.
Earnings heatmaps help traders track:
- Positive surprises
- Negative surprises
- Sector reactions
- Volatility spikes
This improves earnings trading strategies.
Global Market Heatmaps
Global heatmaps monitor:
- US markets
- European exchanges
- Asian indices
- Emerging markets
Global analysis helps traders understand:
- Risk appetite
- International sentiment
- Capital flow
Multi-Timeframe Heatmap Analysis
Professional traders analyze multiple timeframes.
Examples:
- Intraday heatmaps
- Daily heatmaps
- Weekly heatmaps
- Monthly heatmaps
Multi-timeframe analysis improves:
- Trend confirmation
- Entry timing
- Risk control
Heatmaps and Economic Cycles
Economic cycles strongly influence markets.
Heatmaps help traders identify:
- Expansion phases
- Recession signals
- Inflation trends
- Defensive rotation
Macro investors use heatmaps extensively.
Psychological Impact of Visual Trading
Visual tools affect trader psychology significantly.
Heatmaps reduce:
- Information overload
- Emotional confusion
- Analysis fatigue
Clear visualization improves:
- Confidence
- Discipline
- Decision quality
Common Mistakes with Advanced Heatmaps
Overdependence
Heatmaps should support analysis, not replace it.
Ignoring Fundamentals
Strong visual momentum may hide weak fundamentals.
Chasing Extreme Moves
Late entries into crowded trades increase risk.
Misreading Short-Term Noise
Temporary spikes may not represent sustainable trends.
Building a Professional Heatmap Workspace
Professional traders often use:
- Multi-monitor setups
- Real-time scanners
- AI alerts
- Sector dashboards
- Economic calendars
Customization improves efficiency dramatically.
Mobile Heatmap Technology
Modern mobile apps allow traders to:
- Monitor markets remotely
- Receive instant alerts
- Analyze sector movement
- Execute trades quickly
Mobile technology has made market monitoring far more accessible.
The Future of Heatmap Technology
Future innovations may include:
- AI-driven forecasting
- Augmented reality dashboards
- Voice-controlled interfaces
- Predictive sentiment engines
- Personalized market intelligence
Financial visualization will continue evolving rapidly.
Why Heatmaps Matter in Modern Markets
Markets are increasingly:
- Faster
- More global
- More interconnected
- More data-driven
Heatmaps simplify complexity and improve market understanding.
They help traders:
- Identify opportunities quickly
- Understand market structure
- Manage risk effectively
- React faster to changing conditions
Conclusion
Advanced Stock Heatmap Monitors have become essential tools in modern financial markets. They transform enormous amounts of market information into intuitive visual systems that improve speed, awareness, and decision-making.
Professional traders, institutions, hedge funds, and retail investors all benefit from heatmap technology because it provides instant insight into:
- Sector rotation
- Market breadth
- Momentum
- Volatility
- Risk sentiment
As artificial intelligence and financial technology continue advancing, Stock Heatmap Monitors will become even more powerful and sophisticated.
For traders seeking a competitive advantage in increasingly complex global markets, mastering heatmap analysis is no longer optional—it is becoming a necessity.

